Math, Graphs and Notation: What Eddocu Handles
Equations, inline math, function graphs on a Cartesian, charts, math in AI chat answers and LaTeX import with TikZ and PGFPlots. What stays editable, and what is not supported yet: chemistry, Mermaid, math in Markdown blocks.
Updated 5 min read
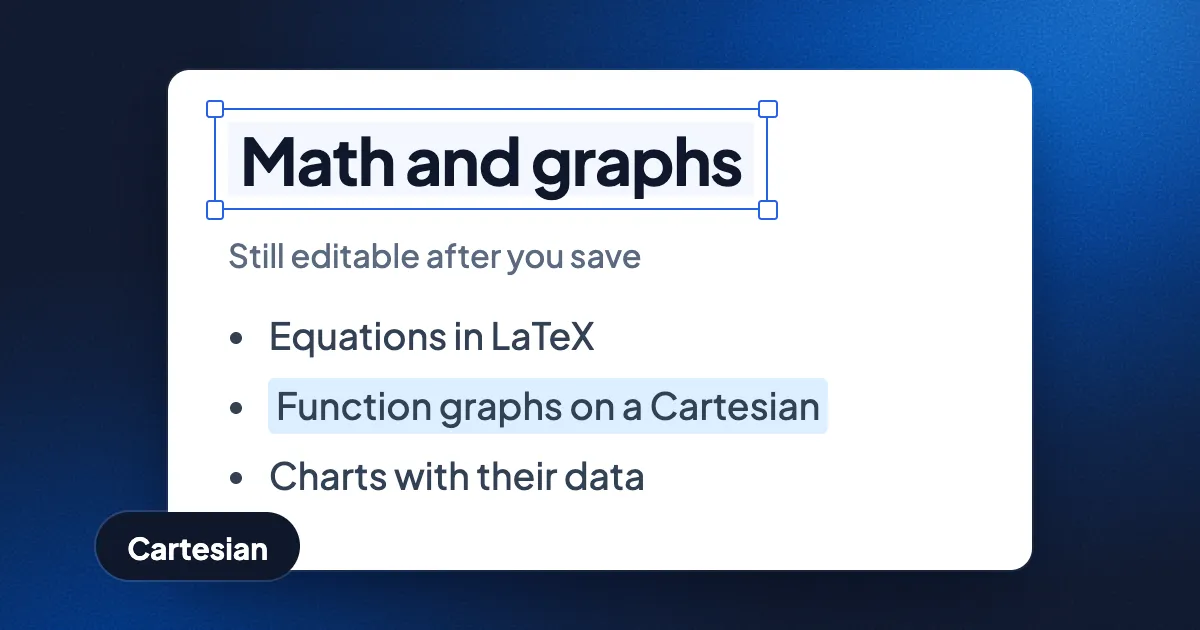
Short answer: Eddocu handles equations, inline math, function graphs and charts as objects you can still edit, in documents and slides. Equations are written as LaTeX or on a math keyboard. Function graphs live on a Cartesian, a coordinate board where each curve is a line of math you can change. Charts keep their data. The AI chat typesets the math in its answers, and a LaTeX project with TikZ and PGFPlots figures imports as an editable document. Chemistry notation, Mermaid diagrams and math inside Markdown blocks are not supported yet.
Eddocu is the editor we make: a document editor for PDF, DOCX and PPTX that works offline, is free for personal use and has no ads; paid plans add AI and cloud sync. This post is the overview. Two other posts go deeper: Write equations in LaTeX, keep them editable covers the equation editor and export, and Open your LaTeX or Overleaf project as an editable document covers LaTeX import.
What Eddocu handles today
| Notation | Supported? | Where |
|---|---|---|
| Equations, typed as LaTeX or on a math keyboard | Yes | Insert, Math |
| Math inside a line of text | Yes | Insert, Math, with the cursor in the line |
| Function graphs, curves and constructions | Yes | Insert, Cartesian |
| Plot a selected equation | Yes | The equation's Plot on a Cartesian button |
| Data charts (bar, line, pie and more) | Yes | Insert, Chart |
| Math in AI chat answers | Yes | The AI chat |
| LaTeX projects with TikZ and PGFPlots | Yes | Import, on the website |
| Equations in Word and PowerPoint files | Yes | Open or import the file |
| Chemistry notation (mhchem, chemfig) | No | |
| Mermaid diagrams | No | |
| Math inside a Markdown block | No | Use Math instead |
Equations and inline math
An Eddocu equation is an editable object, not a picture of one. Open Insert and choose Math, then type LaTeX or build the formula with the Math keyboard. The keyboard has tabs for numbers, functions, letters, Greek letters and relations. With the cursor in a line of text, the equation sits in that line and moves with the words around it. Exported to PDF, an equation is drawn as vectors. Exported to Word or PowerPoint, an equation becomes a native Office equation. The details, shortcuts and current limits are in the equations post.
Function graphs on a Cartesian
A Cartesian is a coordinate board on the page. Insert it from Insert, Cartesian ("Plot functions, points and constructions on axes"), or select an equation and press Plot on a Cartesian to get a new board beside it with that formula. Every object on the board is a row in its Expressions list, typed in the same math editor as equations. Change a row and the curve changes.
- What it plots: functions such as
f(x) = x^2 - 2, implicit curves, shaded inequalities, parametric curves, polar curves, points and sliders. Derivatives (f'(x)), the usual trigonometric, logarithmic and rounding functions, and LaTeX rows such as\frac{a}{b}are read too. - Constructions: segments, lines, rays, vectors, circles, polygons, intersections, midpoints, perpendicular and parallel lines.
- A function on an interval: type
x^2, -1 ≤ x < 2and the Cartesian draws the curve only there, with open and closed ends. - Draw by hand: sketch a curve, and the Cartesian can fit a function to it, such as a line, a polynomial up to degree 3, an exponential or a sine.
- Axes: grid style, axis titles written as math, steps, colours, equal scale and logarithmic axes. A new Cartesian starts print-first: no grid, black axes, black curves.
The Cartesian keeps its source with the document, so the board stays editable after you save and reopen it. Exported to PDF or printed, a Cartesian is drawn as vectors, sharp at any zoom. Exported to Word, PowerPoint or HTML, a Cartesian becomes a picture of the board, not an editable chart.
Charts
A chart is for data rather than functions. Insert, Chart offers bar, line, pie, donut, scatter, area, radar, bubble, combination, stock and pie-of-pie charts. In the chart's properties you edit its series, labels and values, and its look: title, legend position, colours, bar gap or donut hole. A chart type Eddocu cannot draw yet keeps the preview that came with the file, and the properties panel says so.
One limit matters before you rely on charts: charts are not written into exported PowerPoint files yet. Each one becomes a grey "Chart" box in the exported deck, as our PowerPoint on Android test showed. If a deck has charts, keep its original for them.
Math in the AI chat
The AI chat answers in Markdown, and Eddocu typesets the math in those answers. Formulas written as $ … $, $$ … $$, \( … \), \[ … \] or a bare \begin{align} block all show as typeset math, even while the answer is still streaming. A price such as "$5 and $10" stays a price. The AI chat uses AI credits; a free account includes 100 a month. See the AI guide for what it does inside a document.
LaTeX import, TikZ and PGFPlots
A pdfLaTeX project, as a .zip or a single .tex file, imports as an editable Eddocu document on the website, signed in. Equations arrive as editable math. Figures drawn with TikZ and PGFPlots arrive as vector drawings you can move and resize; the TikZ code itself is not kept as an editable figure. XeLaTeX, LuaLaTeX and Biber are not supported yet. The full list is in the LaTeX import post.
Where typical PDF editors stop
A typical PDF editor treats an equation in a PDF as drawn glyphs and a graph as lines or a picture: you can move them, not change the formula. Eddocu does not change that for a plain PDF either. An equation in a PDF you open is text and drawing, not editable math. The difference is what you make or import in Eddocu: equations stay LaTeX, a Cartesian keeps its expressions, a chart keeps its data, and a LaTeX or Office import brings equations in as math. Scans can get there too: the Medium AI scan rebuilds headings, lists, tables and math from photos.
Where other tools are better
- Writing LaTeX. Overleaf or a local TeX editor is where you write and compile a paper. Eddocu imports the finished project one way and does not write a .tex file back.
- Dedicated graphing tools. Eddocu's Cartesian is two-dimensional. For 3D surfaces, statistics or a computer algebra system, use a tool built for that.
- Chemistry and diagrams as code. Structural formulas, reaction notation and Mermaid diagrams need other tools today.
- Charts in PowerPoint. Until chart export lands, PowerPoint keeps charts that Eddocu's PPTX export does not.
Questions
Can I plot a function in a document?
Yes. Insert a Cartesian and type the function in its Expressions list, or select an equation and press Plot on a Cartesian. The graph stays editable in the document.
Can I write chemical formulas in Eddocu?
Simple formulas with subscripts, such as H_2O, work in the math editor as ordinary math. Chemistry packages such as mhchem and chemfig are not supported yet.
Does Eddocu support Mermaid diagrams?
No, not yet. Shapes and flowchart shapes are in Insert, Shape, drawn by hand rather than from code.
Are equations and graphs free?
Yes. Math, the Cartesian and charts are part of the free editor. The AI chat uses AI credits, with a small free monthly allowance. See Free for personal use, or get the app at eddocu.com/download.
Facts checked on 16 November 2026 against Eddocu's math editor, the Cartesian's editor and documentation, the Insert panel, the chart properties, the AI chat's math renderer and the LaTeX importer.